Seeing Seizures
Large-scale benchmark of video vs. EEG deep learning for rodent seizure detection and severity grading
Seeing Seizures is a large-scale empirical study of video and EEG deep learning for automated rodent seizure detection and Racine-scale severity grading. Ten video backbones and seven EEG models are trained under one matched protocol on a synchronized video–EEG cohort, so the two modalities can be compared head to head.
Status: under review (WACV 2027, Applications track) · Project page · Code
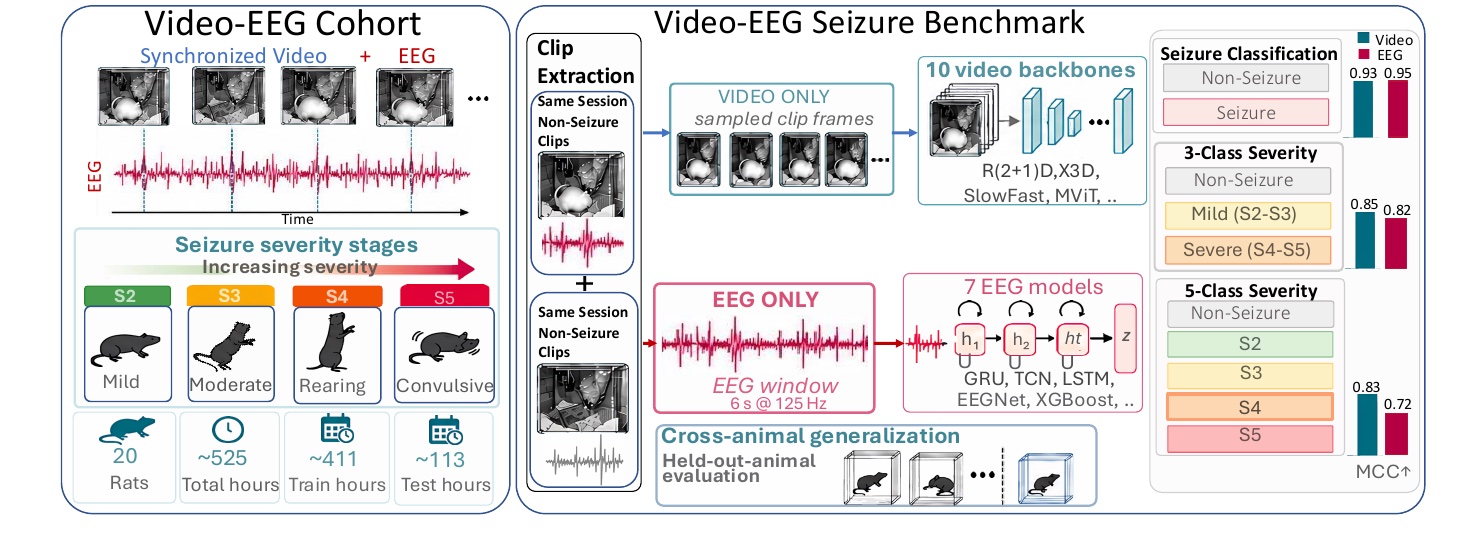
Dataset
- 20 rats, 525.1 hours of paired video + electrode recordings across 601 sessions
- 24,572 clips: 12,228 seizure clips and 12,344 duration-matched non-seizure clips (mean 77.0 s, ±10 s buffer)
- Session-disjoint split: 19,208 train / 5,289 held-out clips; generalization tables also hold out whole animals
Tasks
- Detection: seizure vs. non-seizure
- 3-class grading: none / mild (Stages 2–3) / severe (Stages 4–5)
- 5-class grading: non-seizure + Racine Stages 2, 3, 4, 5
Results
Macro-F1 (mean ± sd over five seeds, matched 12-epoch budget), best model per family:
| Model | Detection | 3-class | 5-class |
|---|---|---|---|
| SlowFast-R50 (video) | 0.973 ± .003 | 0.789 ± .009 | 0.675 ± .008 |
| X3D-M (video) | 0.969 ± .002 | 0.794 ± .005 | 0.586 ± .003 |
| TCN (EEG) | 0.978 ± .001 | 0.767 ± .007 | 0.563 ± .012 |
| GRU (EEG) | 0.974 ± .003 | 0.750 ± .010 | 0.560 ± .005 |
EEG is marginally better at detecting whether a seizure happens, but video clearly wins at grading how severe it is, since Racine stages are defined by visible behaviour (rearing, falling, forelimb clonus).
{
  "tooltip": { "trigger": "axis" },
  "legend": { "data": ["Best video (SlowFast-R50)", "Best EEG (TCN)"], "top": "2%" },
  "grid": { "left": "3%", "right": "4%", "bottom": "3%", "containLabel": true },
  "xAxis": { "type": "category", "data": ["Detection", "3-class", "5-class"] },
  "yAxis": { "type": "value", "name": "Macro-F1", "min": 0.5, "max": 1 },
  "series": [
    {
      "name": "Best video (SlowFast-R50)",
      "type": "bar",
      "data": [0.973, 0.789, 0.675],
      "itemStyle": { "color": "#4f8ef7", "borderRadius": [4, 4, 0, 0] }
    },
    {
      "name": "Best EEG (TCN)",
      "type": "bar",
      "data": [0.978, 0.767, 0.563],
      "itemStyle": { "color": "#e87c7c", "borderRadius": [4, 4, 0, 0] }
    }
  ]
}
- External validation: 0.979 subject-wise F1 on the public RodEpil benchmark
- Explainability: HiResCAM class-evidence maps from X3D-M localize seizure behaviour on the animal
This study builds on the Seizure Video–EEG Synchronisation data pipeline. Work done at SCSLab, Iowa State University.