Seizure Video–EEG Synchronisation
Multimodal EEG + video pipeline for seizure data-distribution analysis
Seizure Video–EEG Synchronisation is an automated pipeline that maps annotated seizure events from Soman(GD)-exposed rats to their behavioural video files — computing exact seek timestamps, coverage gaps, and full seizure-data distributions — to build the data foundation for a multimodal Video+EEG seizure-detection model.
What it does
- Maps each annotated seizure to its video file with exact seek timestamps and boundary-overlap handling
- Extracts synchronized video + EEG clips per seizure with pre / post context buffers
- Characterizes duration, temporal, stage, spike, and inter-seizure-interval distributions
- Extends the EEG-only Ganguly et al. (2025) framework toward multimodal detection
Seizure metrics (RN103-22 vs RN140-22)
| Metric | RN103-22 | RN140-22 |
|---|---|---|
| Total seizures | 54 | 33 |
| Video coverage | 48% | 85% |
| Mean duration (s) | 38.0 | 86.3 |
| Dominant stage | Stage 4 (76%) | Stage 3 (97%) |
| Mean inter-seizure gap (min) | 77.6 | 84.6 |
| Mean spikes per seizure | 1.22 | 0.94 |
{
  "tooltip": { "trigger": "axis" },
  "legend": { "data": ["RN103-22", "RN140-22"], "top": "2%" },
  "grid": { "left": "3%", "right": "4%", "bottom": "3%", "containLabel": true },
  "xAxis": {
    "type": "category",
    "data": ["Total seizures", "Coverage (%)", "Mean dur (s)", "Total time (min)", "Mean gap (min)"]
  },
  "yAxis": { "type": "value" },
  "series": [
    {
      "name": "RN103-22",
      "type": "bar",
      "data": [54, 48, 38.0, 34.2, 77.6],
      "itemStyle": { "color": "#4f8ef7", "borderRadius": [4, 4, 0, 0] }
    },
    {
      "name": "RN140-22",
      "type": "bar",
      "data": [33, 85, 86.3, 47.4, 84.6],
      "itemStyle": { "color": "#e87c7c", "borderRadius": [4, 4, 0, 0] }
    }
  ]
}
Seizure Duration Distribution
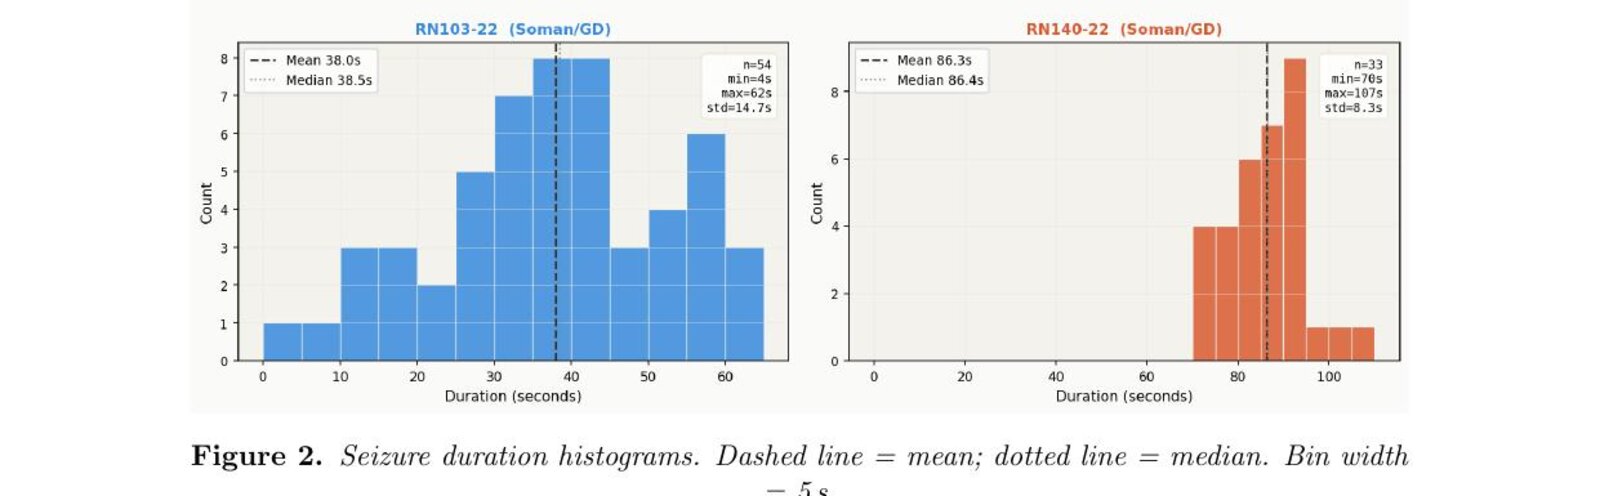
Data foundation for a proposed multimodal seizure-detection model. Note: the report’s Fig 8 shows a mean-gap of 167.3 min for RN140-22 that disagrees with Table 5 (84.6 min); the table value is used here.
Work done at SCSLab, Iowa State University.